Log J1939 data
J1939 is a protocol used in most heavy-duty vehicles (trucks, buses, tractors, …).
In this section we outline how to log J1939 data with your CANedge.
Note
We recommend that you read our J1939 intro before proceeding
Table of Contents
Configure your device
J1939 data is generally broadcast, meaning that you do not need to request it. Instead, you can use the default Configuration File with automatic bit-rate detection.
Our section on reducing your log file size also contains guidance on J1939 PGN filtering.
Record J1939 data
To log J1939 data from a heavy-duty vehicle, you need to find a suitable way to connect the CANedge. Below are the most common methods:
- DB9-J1939: This lets you record J1939 data from most trucks, buses, engines, tractors
- DB9-CAT: This lets you log J1939 data from some Caterpillar vehicles/engines
- DB9/DB9-J1939: This lets you log 2 x J1939 networks in some vehicles (e.g. tractors)
- DB9/DB9-OBD2: This lets you log both J1939/OBD2 in some trucks/buses
- Contactless CH1 / CH2: This lets you log J1939 data directly from the CAN high/low harness
Once you have identified which adapter cable to use you can follow below steps:
- Connect the CANedge to your J1939 application via the adapter cable
- Verify that the device turns on and logs data (CH1 LED and MEM LEDs blink)
- Disconnect the device from power and extract the SD card
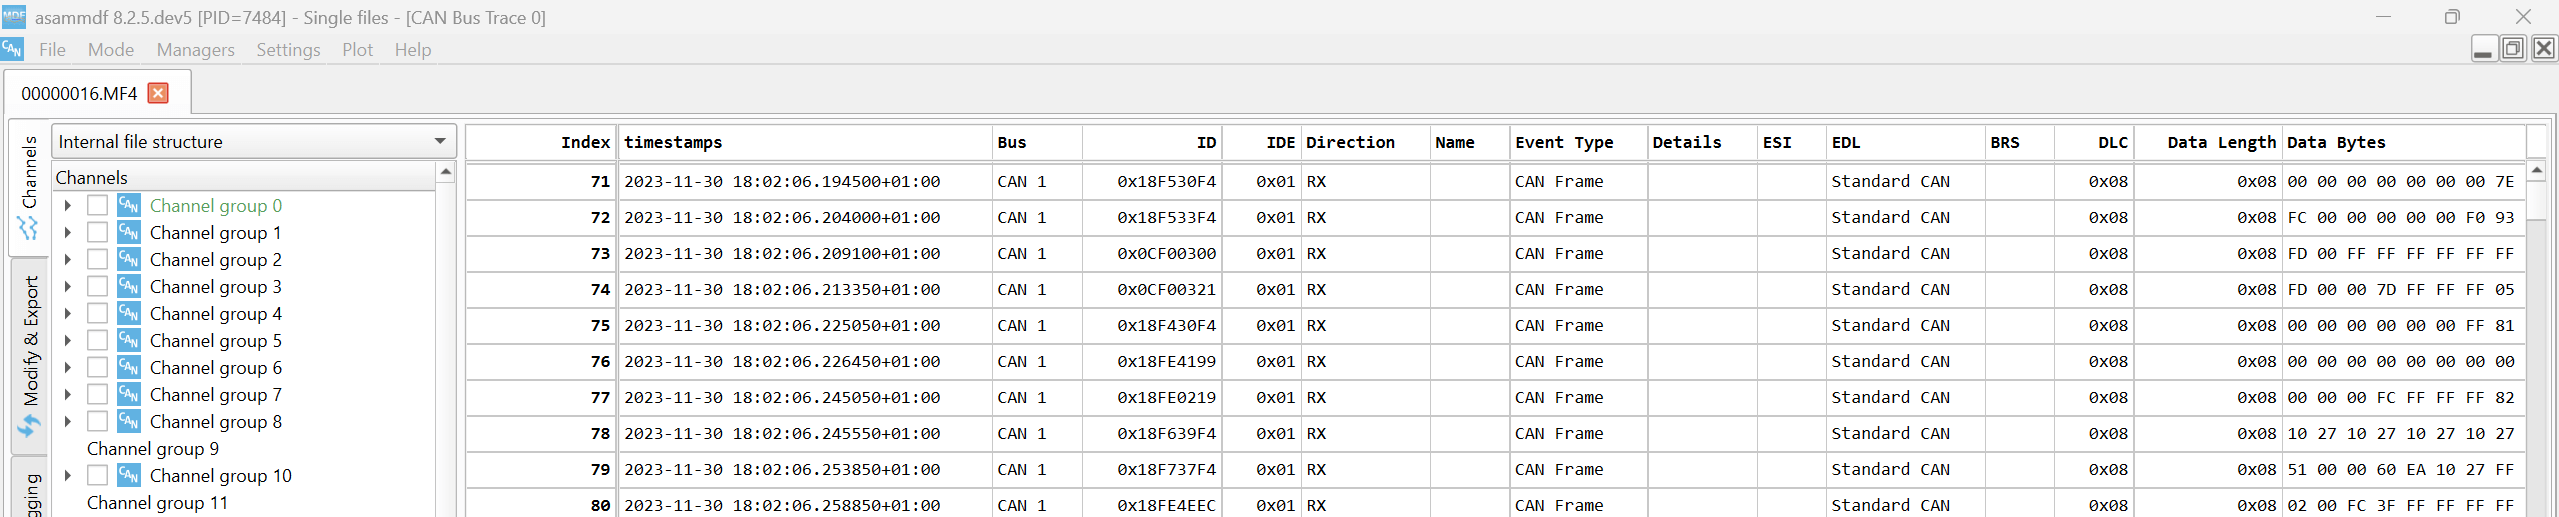
- Open the MF4 in asammdf and display the raw CAN trace - it should look as below:
DBC decode J1939 data
To DBC decode J1939 data you need the associated DBC file. If you are not the equipment manufacturer, you can purchase our J1939 DBC file, which contains 1800+ PGNs and 12000+ SPNs. For most J1939 networks, this lets you decode the majority of the parameters.
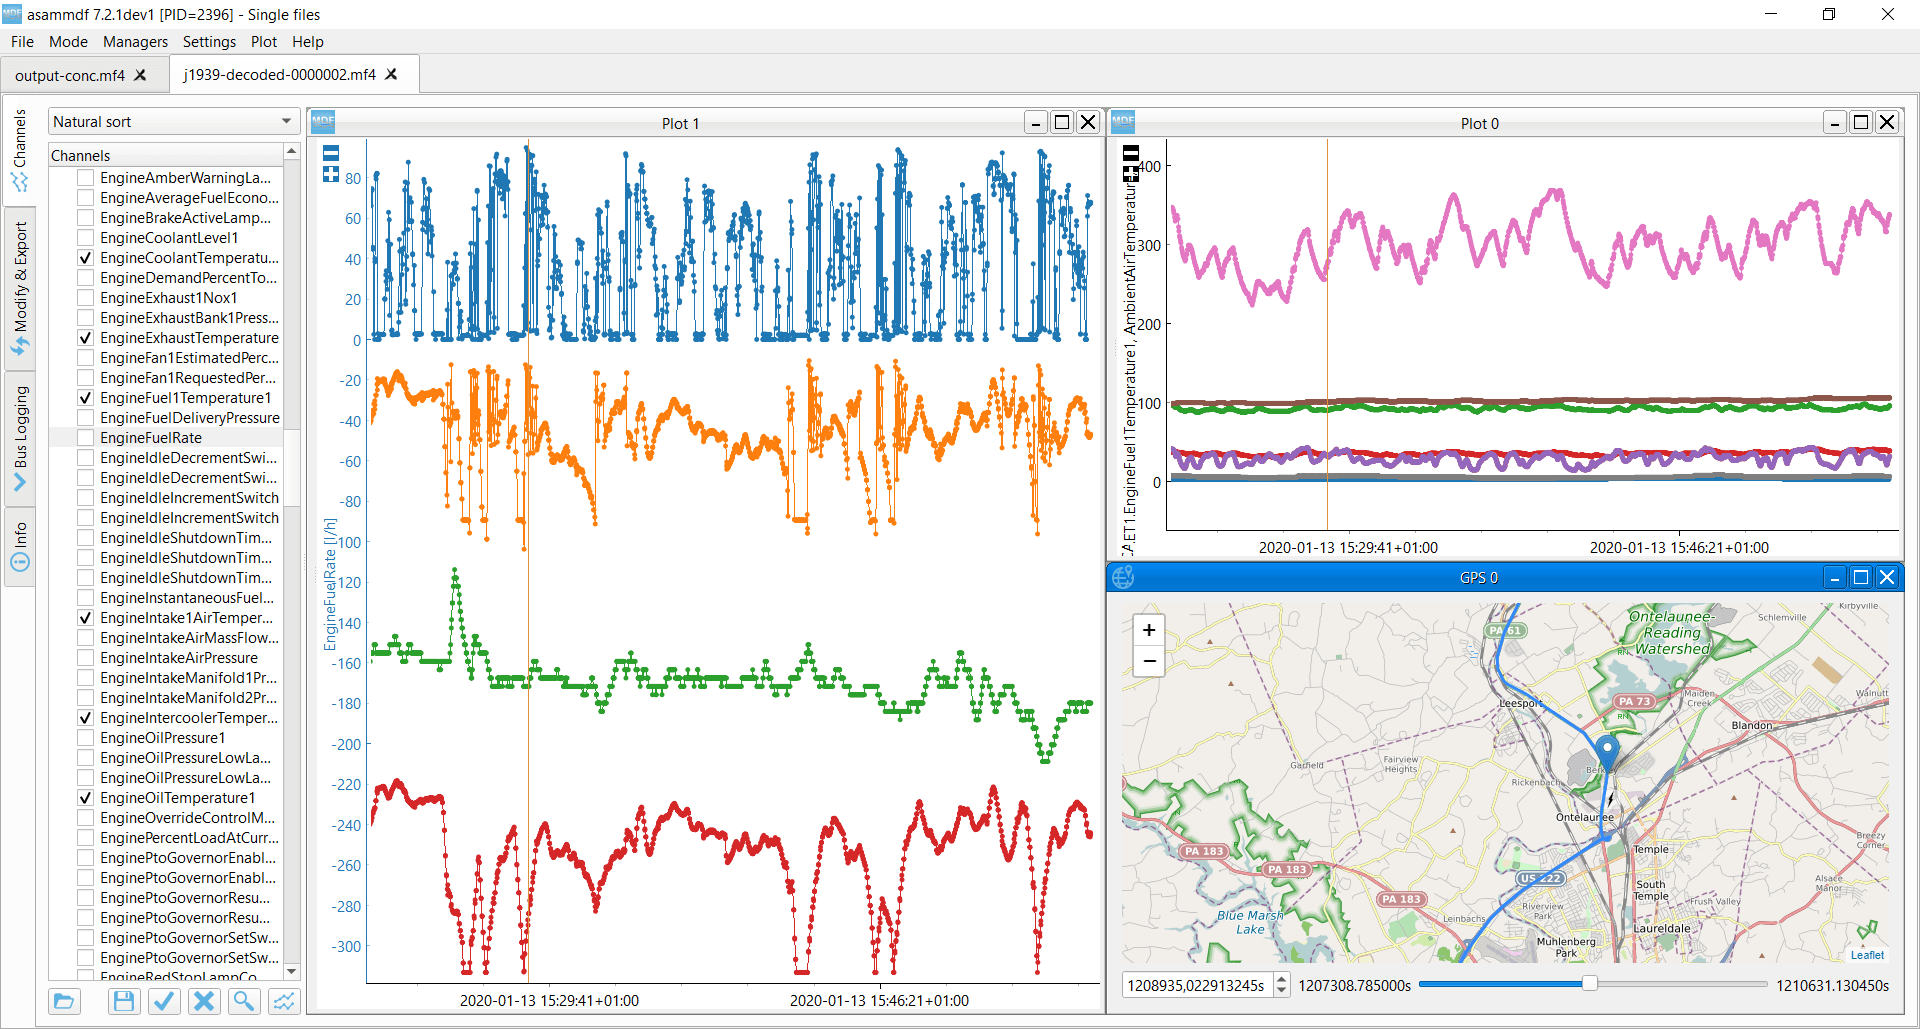
You can decode your data via the processing tools - we recommend to start with asammdf.
Advanced: Log J1939 on-request data
In some cases, you may wish to log on-request J1939 data. To do so, you need to transmit the relevant J1939 request frame into the CAN bus - see also our J1939 simple intro.
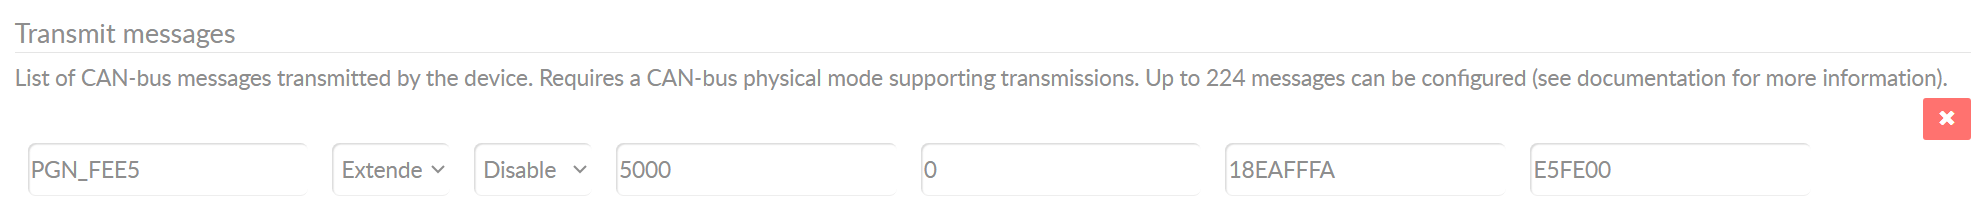
An example is PGN 65253 (FEE5) which contains the SPN Engine Hours. Below we show what the transmit message could look like for this particular PGN. There are two key things to note:
- The transmit frame CAN ID is
18EAFFFA, reflecting the J1939 request PGN59904(EA00) - Note that we use a ‘global request’ (
0xFF) and an arbitrary source address (0xFA) - The data contains the requested PGN
FEE5(note the byte ordering toE5FE)
Note
A vehicle might not respond to your request - and caution should be taken when transmitting[1]
Advanced: Multi-frame J1939 data (J1939 TP)
J1939 often involves multi-frame responses as per J1939 TP, which means that data has to be reassembled before it can be DBC decoded. You can DBC decode and visualize multi-frame data using the MF4 decoders and e.g. Grafana dashboards
Advanced: Separate/merge J1939 source address
When using the MF4 decoders to DBC decode J1939 data, the default settings will separate each decoded J1939 message by source address (adding this as a suffix to each folder). This is typically preferred if you are analyzing a fleet of similar vehicle models (e.g. as an OEM). However, if you are processing data across a ‘mixed fleet’ of vehicles, the source address separation can make it difficult to e.g. visualize data in static Grafana dashboard panels across devices. In such a case, you can add the argument --pgn-src-merge when running the MF4 decoders via the command line - or within e.g. a Lambda automation script. The resulting data lake will join data across multiple source addresses into a single output table.
Advanced: Decode J1939-73 DM1 (DTCs)
If you need to DBC decode and visualize J1939-73 DM1 messages to extract Diagnostic Trouble Codes (DTCs) you should use our MF4 decoders and J1939-73 DBC.
Our J1939-73 DBC files ‘break out’ the DM01 message into the header and separate DTCs. When using the MF4 decoders, this results in separate tables per DTC, header and source address. To make this practical to work with, you can use Python to create a ‘combined’ table across DTCs and source addresses (adding the source address within the table as a separate column).

For DM1 decoding and visualization, we recommend to use our Grafana-Athena integration as this enables the calculated signals Lambda extension (incl. a DM1-specific example). If you deploy this, it adds a new calculated table structured as below:

With the calculated DM1 table you can easily visualize your DTCs in e.g. Grafana - and you can optionally also set up event detection to immediately get notified when a DTC is active (and see all historical events). See also our J1939-73 DM1 Grafana-Athena playground:

| [1] | Be careful if transmitting data onto a vehicle while the ignition is off (as this may ‘wae up’ the ECUs and cause battery drain). If your device remains powered when the ignition is off and you need to transmit data, we recommend using a control signal to start/stop transmission dynamically (see the OBD2 section for examples). |