Write data to InfluxDB via Python
Once you’ve set up Grafana and InfluxDB, the next step is to push data to InfluxDB.
Table of Contents
Download and setup Python script
- Download the CANedge InfluxDB Writer project from github
- Follow the README to install and test the script with the sample data
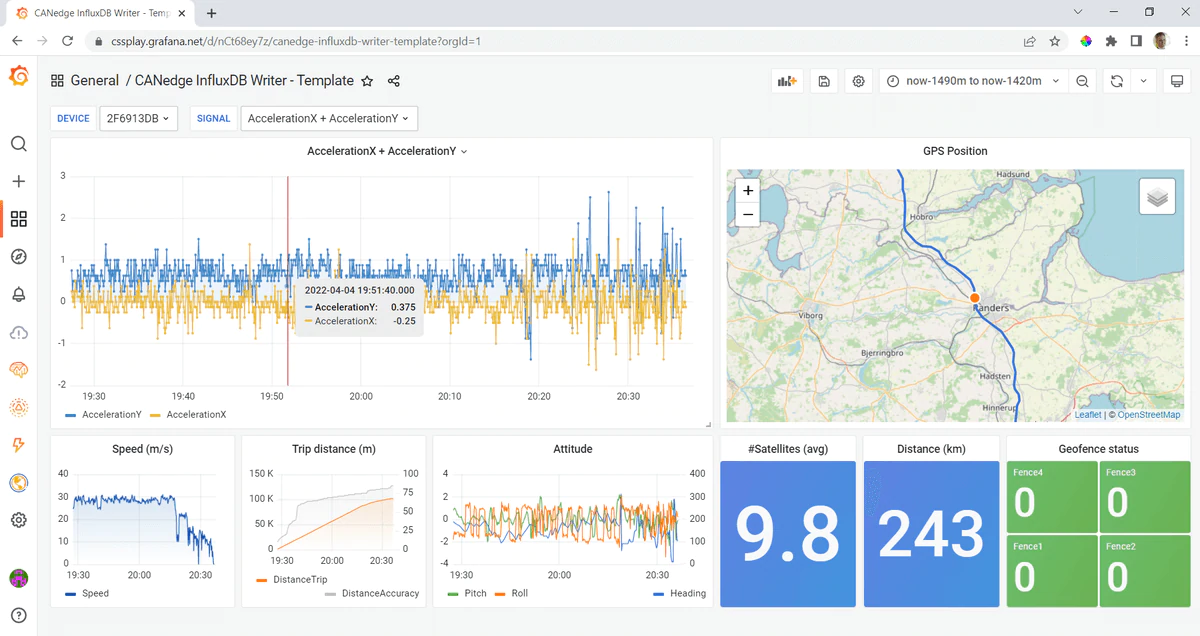
- Once you are done with Step 1 in the README, you should see the below in Grafana:
Modify the script to process your own data
- Change the script to use your own DBC file, devices and data as per the README
- Verify that your own data is processed correctly for the time period you’ve selected[1]
Note
The free tier InfluxDB cloud has a limit of 199 unique signals per device - make sure to modify your DBC file accordingly or add a filtered list of signals in your inputs.py file
Next, build and deploy your Grafana dashboard
| [1] | The free InfluxDB Cloud has a write cap of ~1 MB/min - if you push large amounts of data the script will stall. You can avoid this by reducing your data (e.g. via resampling), upgrading to a paid InfluxDB Cloud account or setting up a free self-hosted version as per our guide |