Build and deploy your dashboard
With your InfluxDB/script in place, you can now build & deploy your Grafana dashboard.
Grafana has a tutorial on panels, so we mainly focus on a few of the basics.
Table of Contents
Leverage the dashboard templates
We recommend that you use our dashboard templates from the github repo as a starting point. These also let you see how various queries can be setup.
In particular, ensure you’ve managed to visualize the sample data from the github repository with the relevant dashboard template.
By using the dashboard template as basis for your own dashboard, the ‘Variables’ enabling dynamic dropdowns will also be setup already.
Set your time period
In Grafana, you can specify what the default time period setting should be for your dashboard. You can set this to a fixed period (e.g. for testing) or a dynamic period (e.g. last 24 hours). When you save the dashboard, you can choose whether to retain the selected time period as the default. For details, see the Grafana docs.
Note
If you are unable to locate your data, try zooming far out to find it
Let users select what data to display via ‘Variables’
You can let your users change which device(s)/signal(s) to display data for via dropdowns.
To create a new dropdown, go to the dashboard settings (upper menu) and Variables/New. Add a dropdown name (e.g. DEVICE/SIGNAL) and add one of the below queries:
Query for devices dropdown
import "influxdata/influxdb/v1"
v1.measurements(bucket: v.defaultBucket)
Query for parameters dropdown
import "influxdata/influxdb/v1"
v1.fieldKeys(bucket: v.defaultBucket)
In your panel queries you can now use below syntax (example for devices dropdown):
from(bucket: v.defaultBucket)
  |> range(start: v.timeRangeStart, stop: v.timeRangeStop)
  |> filter(fn: (r) => r["_measurement"] =~ /${DEVICE:regex}/)
  |> filter(fn: (r) => r["_field"] == "Speed")
  |> aggregateWindow(every: v.windowPeriod, fn: mean)
  |> yield(name: "mean")
If you want a panel where users can both select devices and parameters, you can use below:
from(bucket: v.defaultBucket)
  |> range(start: v.timeRangeStart, stop: v.timeRangeStop)
  |> filter(fn: (r) => r["_measurement"] =~ /${DEVICE:regex}/)
  |> filter(fn: (r) => r["_field"] =~ /${SIGNAL:regex}/)
  |> aggregateWindow(every: v.windowPeriod, fn: mean)
  |> yield(name: "mean")
Display multiple parameters in one panel
In the dashboard script, we showcased how to query a single parameter. In some cases, you may want to query multiple parameters. To do so, you can modify the query as below. You can then click on the legend-line of one of the parameters to change colors or switch to a 2nd Y-axis.
from(bucket: v.defaultBucket)
  |> range(start: v.timeRangeStart, stop: v.timeRangeStop)
  |> filter(fn: (r) => r["_measurement"] =~ /${DEVICE:regex}/)
  |> filter(fn: (r) => r["_field"] == "Speed" or r["_field"] == "AccelerationX")
  |> aggregateWindow(every: v.windowPeriod, fn: mean)
  |> yield(name: "mean")
Panel plugins
Grafana offers a large number of plugins on top of the basic panel types. For example, you install the TrackMap plugin to display GPS coordinates in a panel. Once installed, refresh your browser and find the plugin under your panel types. You can then use a query as below:
from(bucket: v.defaultBucket)
  |> range(start: v.timeRangeStart, stop: v.timeRangeStop)
  |> filter(fn: (r) => r["_measurement"] == "2F6913DB")
  |> filter(fn: (r) => r["_field"] == "Latitude" or r["_field"] == "Longitude")
  |> aggregateWindow(every: v.windowPeriod, fn: median)
  |> yield(name: "median")
Note
To ‘time sync’ time series panels with the GPS map, you need to use the ‘Graph (old)’ plot type
Save & import dashboard templates
You can easily export or import a Grafana dashboard via JSON files as explained here.
Note that you’ll need to modify the queries in imported dashboards to match your data. For inspiration, you can export/import the below playground examples:
Alert notifications
Grafana lets you set alerts to notify if certain thresholds are exceeded for each of your panels - for more on this, see the Grafana docs. Note that when using alerts, you should add the below lines at the top of your panel queries:
windowPeriod = int(v: v.windowPeriod)
myWindow = if windowPeriod < int(v: 100000000) then 1s else v.windowPeriod
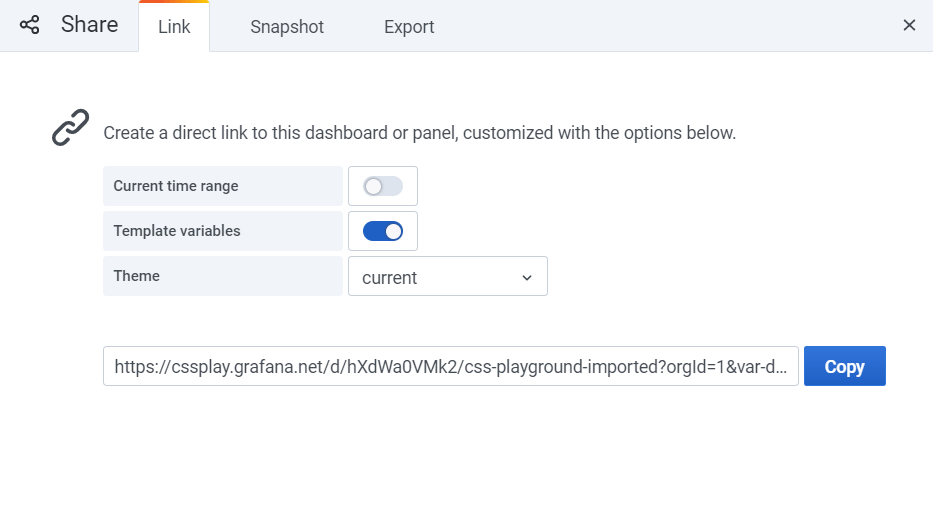
Share/deploy your dashboard
Once you’re ready, you can share your dashboard with other users by clicking the share icon in the upper left corner. You can share the link to allow others to view the dashboard by logging in using your username/password. Alternatively, you can share a snapshot as outlined here.
Tips & tricks
See also our tips & tricks section for more details.