Parquet in Grafana
Warning
The examples on this page are for advanced users and provided without support
Grafana is an open source visualization tool running in a browser. Grafana can be cloud or self-hosted.
The Grafana integration demonstrated on this page requires a ClickHouse server as backend, see Parquet as database with ClickHouse. It is assumed that Grafana is allowed to access the ClickHouse server.
ClickHouse data source
The ClickHouse data source can be installed through the Grafana web interface by selecting Add new connection and searching for ClickHouse.
Variables
Below Grafana variables demonstrate how database-names (here constant), table-names and signal-names can be dynamically queried. The variables can then conveniently be used to construct data queries.
Database name:
Type:
constantName:
databaseValue:
default
Table name:
Type:
queryName:
tableValue:
SELECT table_name FROM information_schema.tables WHERE table_catalog='${database}'
Signal name:
Type:
queryName:
signalValue:
SELECT column_name FROM information_schema.columns WHERE table_catalog = '${database}' and table_name = '${table}' and column_name != 't'
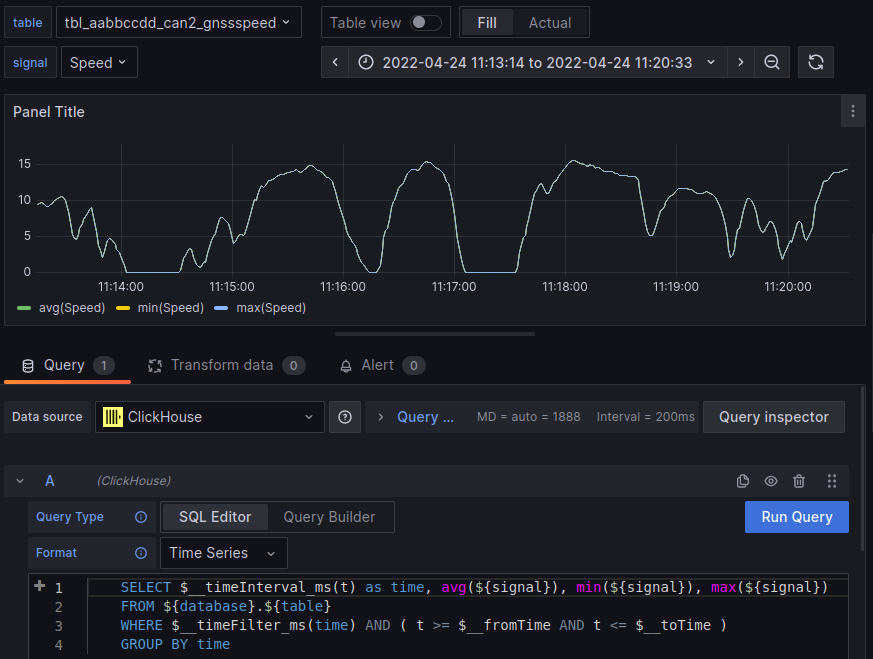
Time-series query
Note
Below example assumes that the variables have been configured.
Below queries average, min and max of signal ${signal} from table ${table} in database ${database} (from within the time interval provided by Grafana).
SELECT $__timeInterval_ms(t) as time, avg(${signal}), min(${signal}), max(${signal})
FROM ${database}.${table}
WHERE $__timeFilter_ms(time) AND ( t >= $__fromTime AND t <= $__toTime )
GROUP BY time