Set up PowerBI-Synapse
Power BI lets you build custom dashboards/reports to visualize data. In this section we explain how you set up Power BI with Azure Synapse as the data source.
Table of Contents
Prerequisites: Azure Parquet data lake + Synapse
- Set up Azure Parquet data lake [~10 min]
- Set up Azure Athena [~5 min]
Note
The above steps are required before proceeding
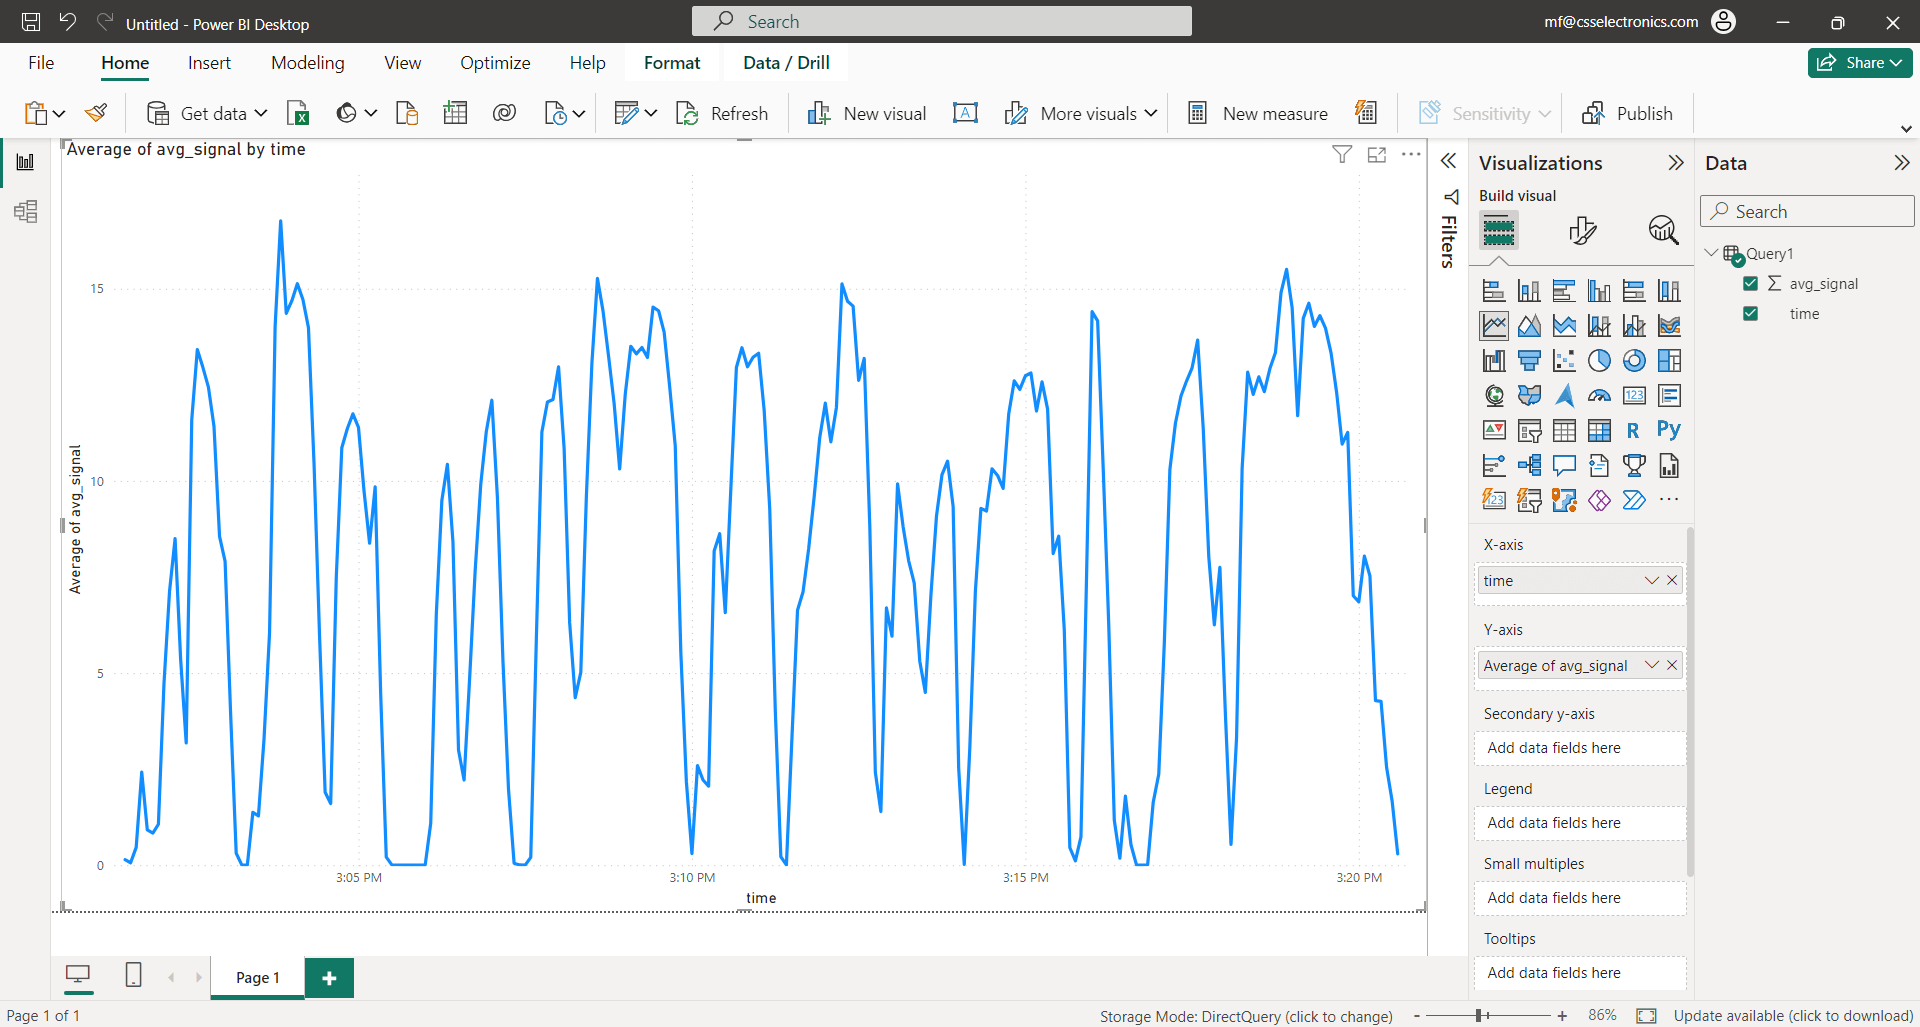
Example 1: Create a basic Power BI Desktop chart

- Make sure you have completed the prerequisites above
- Open Power BI Desktop and create a new report
- Go to ‘Get data/More/Azure Synapse Analytics SQL’
- In ‘Server’, enter your ‘Serverless SQL endpoint’ from the Synapse overview
- In ‘Database’ enter
parquetdatalakeand select ‘DirectQuery’ - In ‘Advanced’ insert below query (after editing the bracketed fields)
- To login, use the ‘Database’ option with
sqladminuserand your SQL admin password
SELECT
   DATEADD(SECOND, DATEDIFF(SECOND, '2000', t) / 5 * 5, '2000') AS time,
   AVG(<signal>) AS avg_signal
FROM
   OPENROWSET(
         BULK '/<deviceid>/<message>/*/*/*/*',
         DATA_SOURCE = 'ParquetDataLake',
         FORMAT = 'PARQUET'
   ) AS r
WHERE
   CONCAT(r.filepath(1), '-', r.filepath(2), '-', r.filepath(3)) BETWEEN '<yyyy-MM-dd>' AND '<yyyy-MM-dd>'
   AND
   t BETWEEN '<yyyy-MM-dd HH:mm:ss>' AND '<yyyy-MM-dd HH:mm:ss>'
GROUP BY
   DATEDIFF(SECOND, '2000', t) / 5
ORDER BY
   time
OFFSET 0 ROWS
The above query achieves a number of things:
- It extracts a single signal and time axis
- It groups the data into 5-second resampled interval averages
- It fetches data directly from the Parquet data lake via
OPENROWSET - It leverages date partitioning to only touch relevant files via the 1st filter
- It then filters the resulting data by time via the 2nd filter
Example 2: Create a dynamic Power BI dashboard
For practical use we recommend to leverage Parameters and Slicers in Power BI. As inspiration, you can download the below pbix file to see how this can be set up. The Power BI file is intended as inspiration, not a plug & play template.