Set up Grafana-Synapse
Grafana lets you build custom dashboards to visualize data. In this section we explain how you set up Grafana with Azure Synapse as the data source (via Microsoft SQL Server).
Table of Contents
Prerequisites: Azure Parquet data lake + Synapse
- Set up Azure Parquet data lake [~10 min]
- Set up Azure Synapse [~5 min]
Note
The above steps are required before proceeding
Set up Grafana and add Synapse data source
- Make sure you have completed the prerequisites above
- Set up a Grafana Cloud starter account (100% free) and login
- In Grafana go to ‘Connections/Data sources/Add new data source’
- Select Microsoft SQL Server as the data source[1]
- Ensure ‘Name’ is
Microsoft SQL Server - In ‘Host’ use your Synapse ‘Serverless SQL endpoint’
- As ‘Database’ use
parquetdatalake - In ‘Authentication’ use
SQL Server Authentication - Authenticate with user
sqladminuserand your SQL admin password[2] - Set the ‘Min time interval’ to
1msand click ‘Save & test’
Note
The data source name must be Microsoft SQL Server for our template dashboards to work
Deploy your first dashboard

- Download our
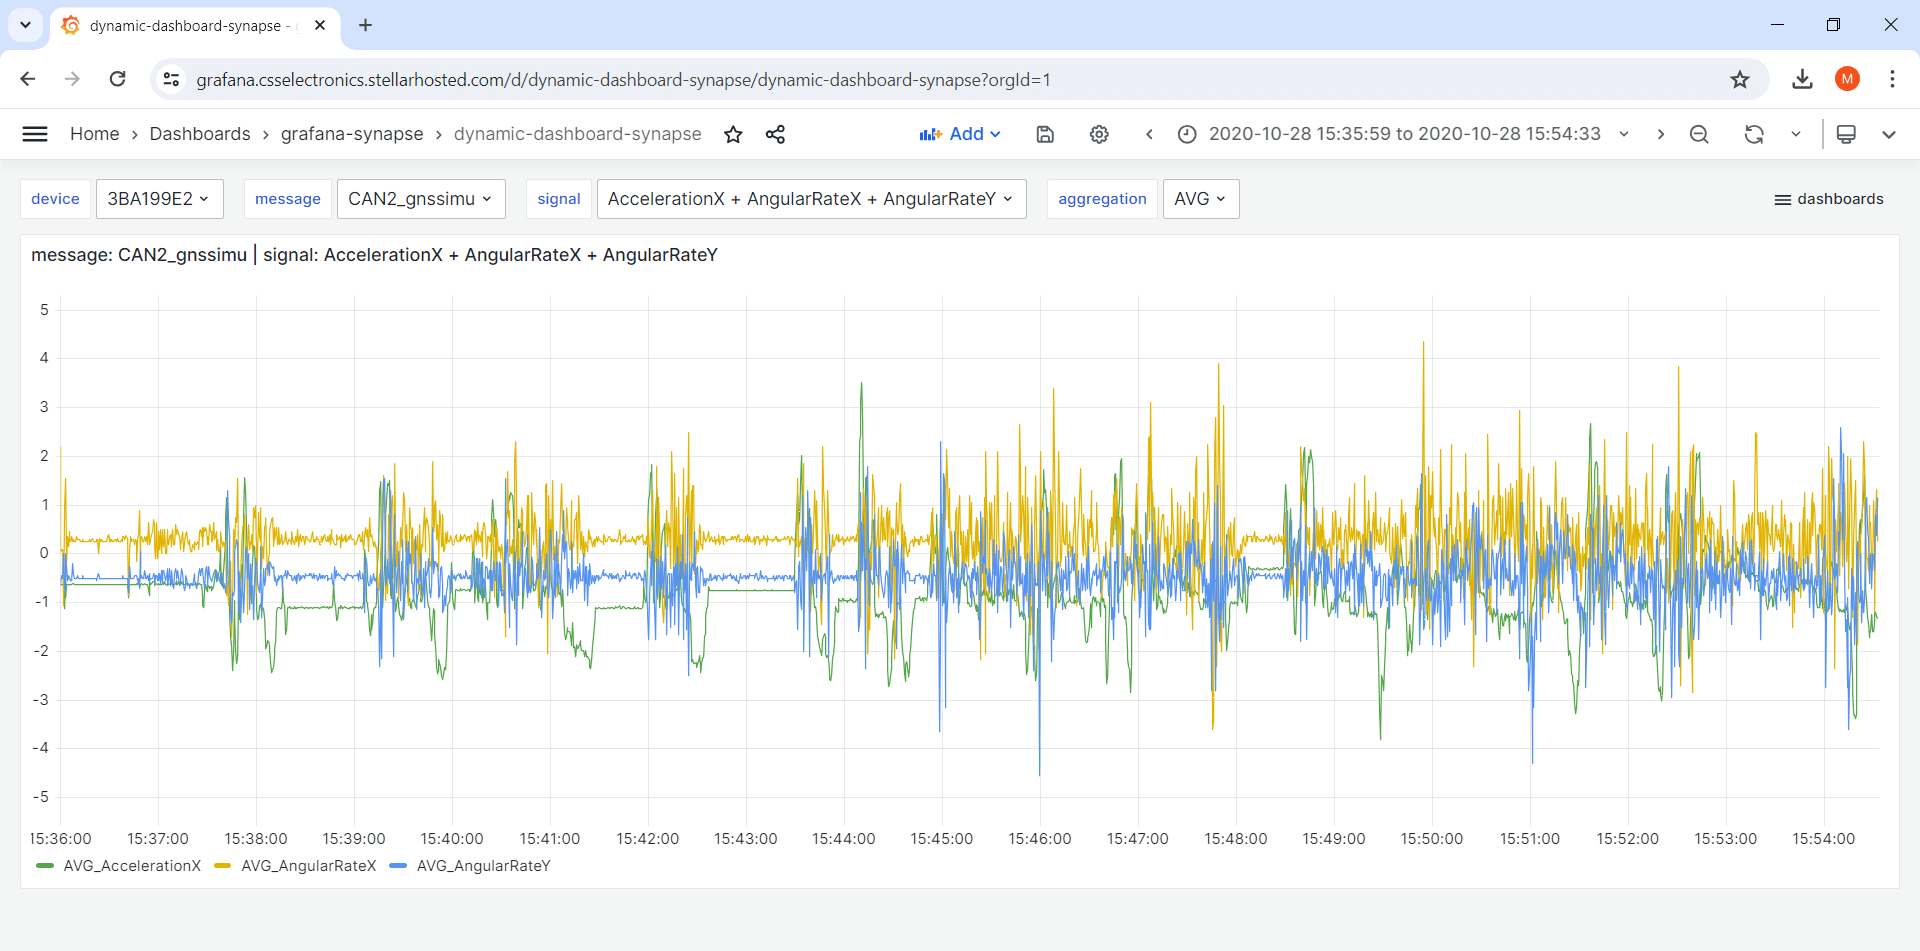
dynamic-dashboard-synapse template - Go to ‘Dashboards/New/Import’, upload the updated template and click ‘Load’
- Verify that your data is loaded in the dashboard as expected[3]
You are now ready to customize your dashboard.
| [1] | There is no Azure Synapse data source in Grafana, hence we use Microsoft SQL Server as the data source instead |
| [2] | You defined this during the creation of the Synapse workspace. You can reset it via the Synapse workspace overview page |
| [3] | You may need to change the time period via the upper-right menu to navigate to your data |